Multiple Choice
Which of the following best describes the series of events shown in the figure? The original conditions prior to the change are shown by D 0 and S 0 (point A) , and S LR is the market long-run supply curve.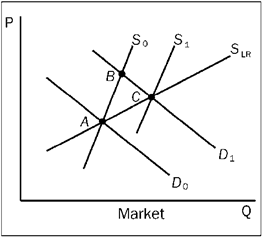
A) an increase in demand and an expansion in the number of firms in an increasing cost industry
B) an increase in demand and an expansion in the number of firms in a decreasing cost industry
C) an increase in demand and an expansion in the number of firms in a constant cost industry
D) none of the above
Correct Answer:

Verified
Correct Answer:
Verified
Q51: The usefulness of the price-taker model requires
Q95: If the market price in a price-taking
Q98: Which of the following products would most
Q118: Several producers in industry A developed an
Q152: Regardless of quantity in long-run equilibrium, the
Q198: In a constant-cost industry, an increase in
Q226: When competition is present, self-interested business decision
Q248: If a single firm in a price-taker
Q458: Use the figure to answer the following
Q459: Use the figure to answer the following