Multiple Choice
The graph below depicts the cost structure for a firm in a competitive market.
Figure 9-13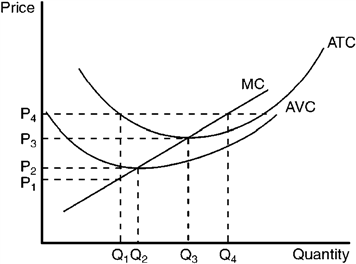
Refer to Figure 9-13. When price falls from P3 to P1, the firm finds that
A) fixed cost is higher at a production level of Q1 than it is at Q3.
B) it should produce Q1 units of output.
C) it should produce Q3 units of output.
D) it should shut down immediately.
Correct Answer:

Verified
Correct Answer:
Verified
Q34: In a competitive price-taker market, the actions
Q42: The entry of new firms into a
Q106: Competition as a dynamic process implies that
Q126: If firms in a price-taker industry were
Q155: Use the figure to answer the following
Q156: The figure depicts a firm in a
Q159: Use the figure to answer the following
Q186: There are 1,000 identical firms in a
Q229: Which one of the following factors is
Q246: Suppose product price is $24; MR =