Multiple Choice
The graph below depicts the cost structure for a firm in a competitive market.
Figure 9-13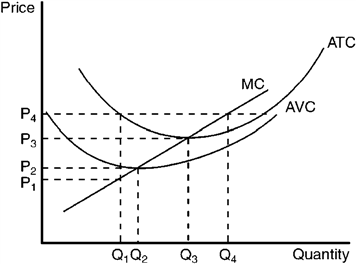
Refer to Figure 9-13. When price rises from P3 to P4, the firm finds that
A) fixed costs are lower at a production level of Q4.
B) it can earn a positive profit by increasing production to Q4.
C) profit is still maximized at a production level of Q3.
D) average revenue exceeds marginal revenue at a production level of Q4.
Correct Answer:

Verified
Correct Answer:
Verified
Q50: Firms that can choose what price they
Q67: When a firm in a competitive market
Q109: When profits occur in a competitive market,
Q110: If a product is manufactured under conditions
Q206: In general, firms will produce at a
Q323: Table 9-2<br><img src="https://d2lvgg3v3hfg70.cloudfront.net/TBX9057/.jpg" alt="Table 9-2
Q324: The schedule of total costs for a
Q327: Which of the following is true?<br>A) When
Q329: Use the table of expected cost and
Q470: If marginal revenue exceeds marginal cost at