Multiple Choice
Which of the following best describes the series of events shown in the figure? The original conditions prior to the change are shown by D 0 and S 0 (point A) , and S LR is the market long-run supply curve.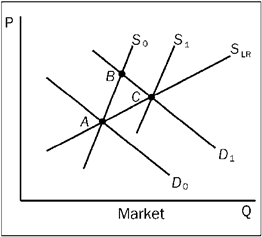
A) an increase in demand and an expansion in the number of firms in an increasing cost industry
B) an increase in demand and an expansion in the number of firms in a decreasing cost industry
C) an increase in demand and an expansion in the number of firms in a constant cost industry
D) none of the above
Correct Answer:

Verified
Correct Answer:
Verified
Q26: Suppose a typical firm in a particular
Q27: Use the figure to answer the following
Q34: Scenario 9-1 Assume a certain competitive price-taker
Q35: Use the figure to answer the following
Q48: The supply curve of a price-taker firm
Q94: The competitive price-taker model is usually used
Q102: If the demand for a product increases
Q152: Regardless of quantity in long-run equilibrium, the
Q179: Which of the following is a characteristic
Q370: Historically, most economists have referred to markets