Multiple Choice
The figure below illustrates the cost and revenue structure for a monopoly firm.
Figure 11-17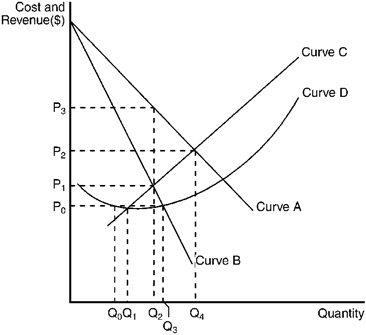
Refer to Figure 11-17. Profit will be maximized by charging a price equal to
A) P0.
B) P1.
C) P2.
D) P3.
Correct Answer:

Verified
Correct Answer:
Verified
Related Questions
Q61: One answer to the problem of natural
Q88: Which of the following is true under
Q89: Because of the rise of global competition
Q106: The Redwood City Council has decided that
Q146: A monopolist will maximize profits by<br>A) setting
Q155: Breaking a monopoly firm into several rival
Q159: If the average total cost curve is
Q165: If the government wants a natural monopoly
Q204: Economic theory suggests that government-operated monopolies will<br>A)
Q214: Which of the following is not a