Multiple Choice
Figure 15-1 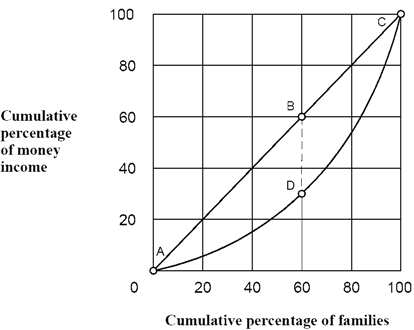
As shown in Figure 15-1, the perfect equality line is drawn between points
A) A and B.
B) B and D.
C) A and C along the straight line.
D) A and C along the curve.
Correct Answer:

Verified
Correct Answer:
Verified
Related Questions
Q11: Why does the government provide benefits in-kind?
Q26: Data indicate that the large increase in
Q48: Because the United States has a progressive
Q49: Which of the following contributed most to
Q50: Which of the following is true?<br>A) The
Q54: Compared to low-income families, high-income families tend
Q58: "Annual income during the prime working years
Q84: If the marginal productivity of labor was
Q92: Which of the following is accurate regarding
Q93: In a market economy, differences in incomes