Multiple Choice
Figure 15-4 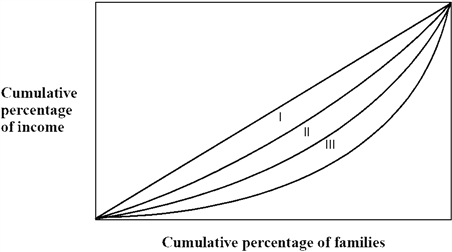
Figure 15-4 shows the Lorenz Curve for three countries, I, II, and III. Which of the following statements is true?
A) Country I has the most unequal income distribution.
B) Country II has the most unequal income distribution.
C) Country I has the most equal income distribution.
D) Country III has the most equal income distribution.
E) Country II has a more equal income distribution than Country I.
Correct Answer:

Verified
Correct Answer:
Verified
Q6: It would be more reasonable to use
Q7: Government programs that take money from high-income
Q15: Andy observes that the income distribution between
Q123: Since 1970, income inequality in the United
Q124: (I) High implicit marginal tax rates reduce
Q126: Which of the following is not counted
Q127: Figure 15-1 <img src="https://d2lvgg3v3hfg70.cloudfront.net/TBX9057/.jpg" alt="Figure 15-1
Q129: The Earned Income Tax Credit<br>A) tends to
Q131: The idea that transfer benefits to the
Q133: What percent of the families classified as