Multiple Choice
Figure 15-4 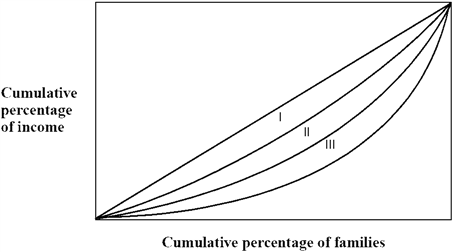
Figure 15-4 shows the Lorenz Curve for three countries, I, II, and III. Of the three countries shown,
A) country III has the most unequal income distribution.
B) country II has the most unequal income distribution.
C) country I has the most unequal income distribution.
D) country III has the most equal income distribution.
E) country II has a more equal income distribution than Country I.
Correct Answer:

Verified
Correct Answer:
Verified
Q3: If substantial income mobility is present,<br>A) there
Q13: (I) Positive economics cannot determine how much
Q39: Compared to low-income families, a larger proportion
Q50: Why don't we divide the economic pie
Q62: "There is considerable movement up and down
Q63: When a person who receives welfare benefits
Q63: Use the following two statements to answer
Q65: In 2009, the proportion of all poverty-level
Q66: Figure 15-3 <img src="https://d2lvgg3v3hfg70.cloudfront.net/TBX9057/.jpg" alt="Figure 15-3
Q69: Which one of the following groups has