Multiple Choice
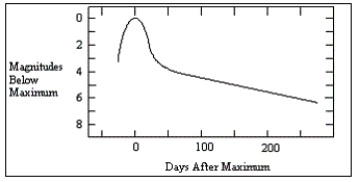
-The diagram shows a light curve from a supernova.How many days after maximum light did it take for the supernova to decrease in brightness by 5 magnitudes?
A) less than 50
B) 50
C) 150
D) 250
Correct Answer:

Verified
Correct Answer:
Verified
Related Questions
Q13: Type II supernovae are believed to occur
Q23: If neutron stars contain no nuclear fuel,
Q29: Theory predicts that neutron stars may not
Q34: Giant and supergiant stars are rare because
Q100: Helium fusion does not begin until the
Q102: What is the approximate size of the
Q107: Why can't the lowest mass stars become
Q108: Which of the following offered support for
Q109: Suppose you discover a binary star system
Q111: Why can't pulsars be spinning white dwarfs?<br>A)White