Multiple Choice
Exhibit 3-3 Demand curves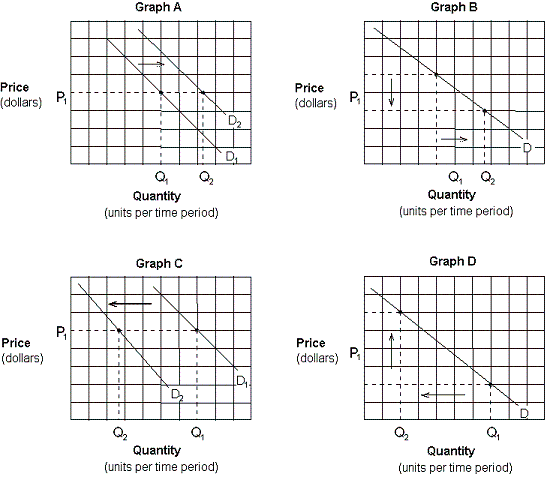
-Which of the graphs in Exhibit 3-3 depicts the effect of a decrease in the price of domestic cars on the demand for foreign cars?
A) Graph A.
B) Graph B.
C) Graph C.
D) Graph D.
Correct Answer:

Verified
Correct Answer:
Verified
Related Questions
Q37: <img src="https://d2lvgg3v3hfg70.cloudfront.net/TBX8793/.jpg" alt=" In the
Q38: If the quantity demanded of milk is
Q39: Assuming that bus travel is an inferior
Q40: A decrease in the price of coffee,
Q41: All of the following apply to the
Q43: The price of a good will fall
Q44: Suppose ABC Corporation is willing to sell
Q45: Exhibit 3-8 Demand and Supply Data for Video
Q46: The demand schedule for a good shows:<br>A)
Q47: A supply schedule shows the relationship between:<br>A)