Multiple Choice
Exhibit 3-3 Demand curves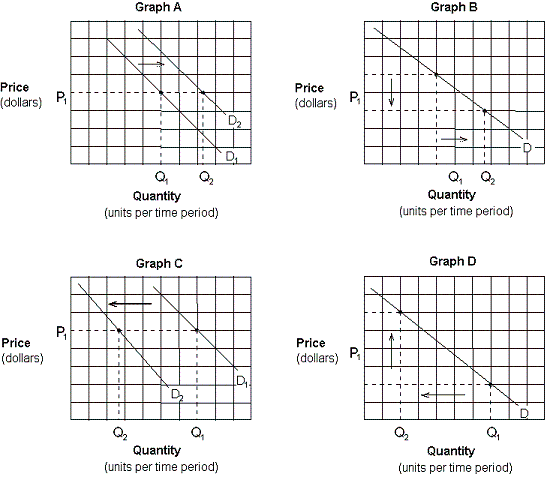
-Which of the graphs in Exhibit 3-3 depicts the effect of a decrease in the price of pizza on the demand curve for pizza?
A) Graph A.
B) Graph B
C) Graph C.
D) Graph D.
Correct Answer:

Verified
Correct Answer:
Verified
Q57: If the United Auto Workers union can
Q58: <img src="https://d2lvgg3v3hfg70.cloudfront.net/TBX8793/.jpg" alt=" -In Exhibit
Q59: Exhibit 3-4 Supply curves<br><img src="https://d2lvgg3v3hfg70.cloudfront.net/TBX8793/.jpg" alt="Exhibit 3-4
Q60: Suppose all of the major computer manufacturers
Q63: Sugar and honey are viewed as substitutes
Q64: Ceteris paribus , which of the following
Q65: Assuming that travel from New York to
Q66: If people expect the price of packaged
Q67: The market demand is the:<br>A) horizontal sum
Q149: According to the law of supply,<br>A) more