Multiple Choice
Exhibit 3-3 Demand curves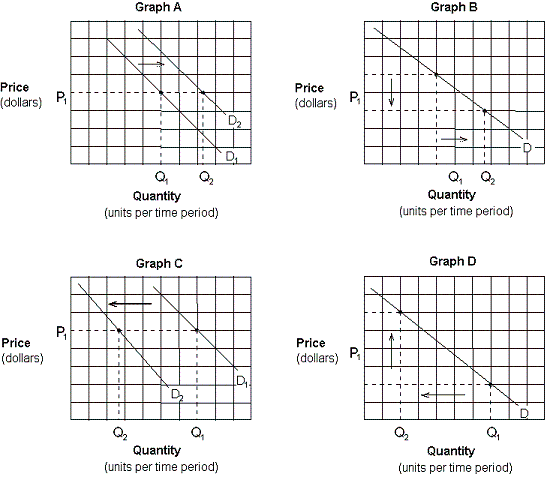
-Assume that crackers and soup are complementary goods. Which of the graphs in Exhibit 3-3 depicts the effect of a promotional discount that decreases the price of crackers on the demand for soup?
A) Graph A.
B) Graph B.
C) Graph C.
D) Graph D.
Correct Answer:

Verified
Correct Answer:
Verified
Q4: Which of the following events would increase
Q5: Which of the following will reduce the
Q6: The most plausible reason why changes in
Q7: Exhibit 3-5 Supply for Tucker's Cola Data<br>
Q8: If Congress decides to reduce the tax
Q10: A technological improvement in producing good A
Q11: Which of the following could cause the
Q12: Exhibit 3-1 Market Demand<br><img src="https://d2lvgg3v3hfg70.cloudfront.net/TBX8793/.jpg" alt="Exhibit 3-1
Q13: An increase in demand:<br>A) results in a
Q14: If equilibrium is present in a market:<br>A)