Multiple Choice
Exhibit 3-3 Demand curves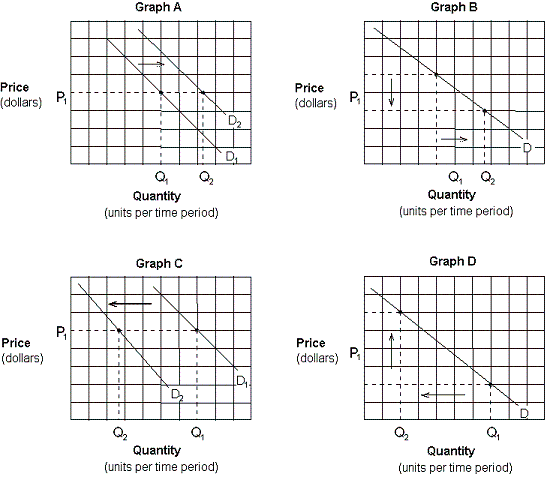
-Which of the graphs in Exhibit 3-3 depicts the effect of an increase in income on the demand for pork and beans (an inferior good) ?
A) Graph A .
B) Graph B .
C) Graph C .
D) Graph D .
Correct Answer:

Verified
Correct Answer:
Verified
Related Questions
Q166: Assume Q<sub>s</sub> represents the quantity supplied at
Q167: At a price of $5, Sam buys
Q168: "Because of unseasonable cold weather, much of
Q169: Which of the following will cause a
Q170: The negative slope of the demand curve
Q171: A decrease in supply means that:<br>A) the
Q172: The law of demand states that:<br>A) as
Q174: Other things being equal, the effect of
Q175: We can find the market supply for
Q176: An increase in the quantity demanded of