Multiple Choice
Exhibit 3-3 Demand curves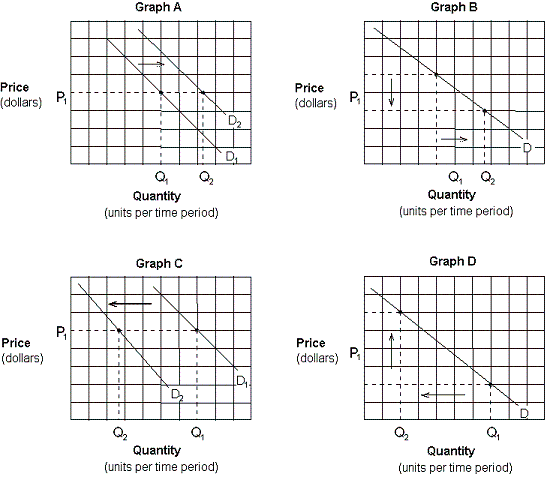
-Assume that consumers expect the price of gasoline to rise sharply in the future. Which of the graphs in Exhibit 3-3 depicts this effect?
A) Graph A.
B) Graph B.
C) Graph C.
D) Graph D.
Correct Answer:

Verified
Correct Answer:
Verified
Related Questions
Q160: The use of a price system eliminates:<br>A)
Q161: If the current market price is above
Q162: A technological improvement in the production of
Q163: A demand curve for The Steel Porcupines'
Q164: A movement along the demand curve for
Q166: Assume Q<sub>s</sub> represents the quantity supplied at
Q167: At a price of $5, Sam buys
Q168: "Because of unseasonable cold weather, much of
Q169: Which of the following will cause a
Q170: The negative slope of the demand curve