Multiple Choice
Exhibit 4-8 Demand and supply curves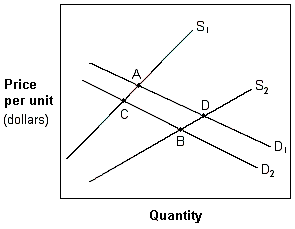
In Exhibit 4-8, a movement from A to C is best described as a(n) :
A) increase in the quantity supplied and a decrease in the demand.
B) decrease in the quantity supplied and a decrease in demand.
C) decrease in the quantity supplied and an increase in demand.
D) decrease in the quantity demanded and a decrease in supply.
Correct Answer:

Verified
Correct Answer:
Verified
Q22: Collusive action among producers creates higher prices
Q23: <table border="0" cellspacing="0" cellpadding="0" align="" style="border-collapse:collapse;font-family:
Q24: Which of the following is an example
Q25: Exhibit 4-10 Supply and demand data for
Q26: Suppose prices for new homes have risen,
Q28: One of the problems created by price
Q29: Sometimes the government deals with externalities by
Q30: A price ceiling:<br>A) is the lowest price
Q31: Exhibit 4-6 Demand and supply curves<br><img src="https://d2lvgg3v3hfg70.cloudfront.net/TBX8793/.jpg"
Q32: Exhibit 4-2 Supply and demand curves<br><img src="https://d2lvgg3v3hfg70.cloudfront.net/TBX8793/.jpg"