Multiple Choice
Exhibit 4-8 Demand and supply curves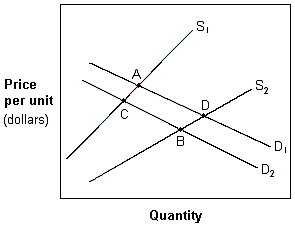
In Exhibit 4-8, a movement from A to B is best explained by:
A) an increase in income and in the number of suppliers.
B) an increase in the price of other goods.
C) an increase in the population.
D) a decrease in income if X is a normal good and an improvement in the technology used to produce the good.
Correct Answer:

Verified
Correct Answer:
Verified
Q78: City streets, sewage systems, and police protection
Q79: In the presence of positive externalities, a
Q80: Exhibit 4-10 Supply and demand data for
Q81: Discuss the impact of demand and supply
Q82: Which of the following is the best
Q84: Exhibit 4-6 Demand and supply curves<br><img src="https://d2lvgg3v3hfg70.cloudfront.net/TBX8793/.jpg"
Q85: An increase in both supply and demand
Q86: Public goods differ from private goods in
Q87: Which of the following would be an
Q88: Which of the following would decrease the