Multiple Choice
Exhibit 4-8 Demand and supply curves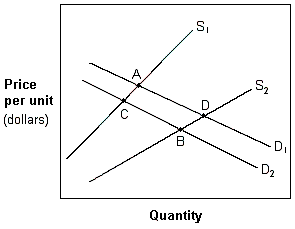
In Exhibit 4-8, a movement from A to B in which price has decreased and quantity has increased is best explained by a(n) :
A) increase in supply and demand.
B) decrease in supply and demand.
C) increase in supply that dominates a decrease in demand.
D) increase in demand that dominates a decrease supply.
Correct Answer:

Verified
Correct Answer:
Verified
Q7: Exhibit 4-5 Supply and demand curves for
Q8: Exhibit 4-3 Supply and demand curves<br><img src="https://d2lvgg3v3hfg70.cloudfront.net/TBX8793/.jpg"
Q9: Exhibit 4-3 Supply and demand curves<br><img src="https://d2lvgg3v3hfg70.cloudfront.net/TBX8793/.jpg"
Q10: External benefits cause the market to:<br>A) underallocate
Q11: Cindy discovers that when she goes to
Q13: When airplanes take off and land at
Q14: Consider the market for chicken. Assuming that
Q15: Exhibit 4-1 Supply and demand data<br> <table
Q16: Consider the market for grapes. An increase
Q17: When there are positive externalities associated with