Multiple Choice
Exhibit 5-9 Supply and Demand Curves for Good X
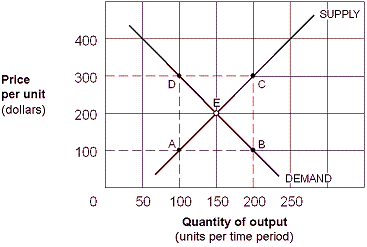
As shown in Exhibit 5-9, the price elasticity of demand for good X between points E and B is:
A) 3/7 = 0.43.
B) 7/3 = 2.33.
C) 1/2 = 0.50.
D) 1.
Correct Answer:

Verified
Correct Answer:
Verified
Related Questions
Q76: In the country of Bora Bora, consumers
Q77: Exhibit 5-5 Demand curve for computers<br><br><img src="https://d2lvgg3v3hfg70.cloudfront.net/TBX8793/.jpg"
Q78: If a demand curve for a good
Q79: Which of the following goods is likely
Q80: Suppose the price elasticity of demand for
Q82: As one moves down a straight-line, down-sloping
Q83: Since it is always a negative number,
Q84: As the economy recovers from a recession,
Q85: Exhibit 5-7 Demand curve for concert tickets<br><br><img
Q86: If a consumer's purchases of a product