Multiple Choice
Exhibit 7-12 Cost schedule for producing pizza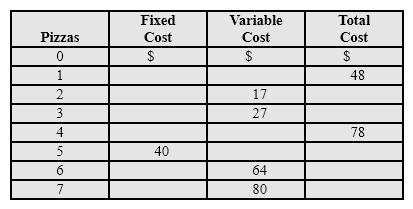
In Exhibit 7-12, the marginal cost of producing the 3rd pizza
A) is higher than the average total cost of 3 pizzas, so the average total cost curve is increasing at a quantity of 3 pizzas.
B) is lower than the average total cost of 3 pizzas, so the average total cost curve is decreasing at a quantity of 3 pizzas.
C) is equal to the average total cost of 3 pizzas, so the average total cost curve is minimized at a quantity of 3 pizzas.
D) is higher than the average fixed cost of 3 pizzas, so the average fixed cost curve is increasing at a quantity of 3 pizzas.
Correct Answer:

Verified
Correct Answer:
Verified
Q38: Economies of scale can be caused by
Q39: Economies of scale imply that within some
Q40: When total revenue minus total cost is
Q41: Exhibit 7-15 Long-run average cost<br><img src="https://d2lvgg3v3hfg70.cloudfront.net/TBX8793/.jpg" alt="Exhibit
Q42: Suppose the marginal product is maximized when
Q44: Exhibit 7-6 Total cost curves<br><img src="https://d2lvgg3v3hfg70.cloudfront.net/TBX8793/.jpg" alt="Exhibit
Q45: Which statement about the total variable cost
Q46: Exhibit 7-15 Long-run average cost<br><img src="https://d2lvgg3v3hfg70.cloudfront.net/TBX8793/.jpg" alt="Exhibit
Q47: American Airlines makes numerous nonstop flights from
Q48: Exhibit 7-1 Production of pizza data<br><img src="https://d2lvgg3v3hfg70.cloudfront.net/TBX8793/.jpg"