Multiple Choice
Exhibit 8-1 Disposable income and consumption data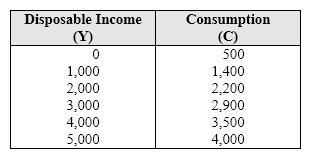
In Exhibit 8-1, when disposable income is increased from $2,000 to $3,000 to $4,000, the marginal propensity to consume
A) remains constant.
B) increases from 0.6 to 0.7.
C) decreases from 0.8 to 0.7.
D) decreases from 0.7 to 0.6.
Correct Answer:

Verified
Correct Answer:
Verified
Q4: The consumption function shows the relationship between<br>A)
Q9: An upward shift in the consumption function,
Q10: The sum of the marginal propensity to
Q11: If a major technological breakthrough occurs, then
Q12: The French economist Jean-Baptiste Say transformed the
Q15: When one observes consumption and investment patterns
Q16: The hands-off view of the classical school
Q17: The demand curve for investment in the
Q18: That part of disposable income not spent
Q19: Which of the following will increase investment