Multiple Choice
Exhibit 10-7 Aggregate supply and demand curves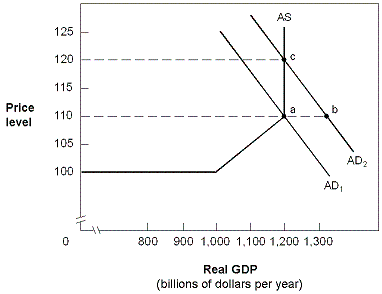
In Exhibit 10-7, the aggregate demand and supply curves reflect an economy in which:
A) full employment is at $1,000 billion GDP.
B) excess aggregate supply is created when there is a shift from AD1 to AD2.
C) excess aggregate demand forces prices up to P = 120.
D) excess aggregate demand causes prices to stabilize at P = 110.
Correct Answer:

Verified
Correct Answer:
Verified
Q54: Which of the following would shift the
Q55: Discuss the three ranges of the aggregate
Q57: In the aggregate demand and supply model,
Q58: A cut in government spending, a decrease
Q60: Exhibit 10-8 Aggregate demand and supply<br><img src="https://d2lvgg3v3hfg70.cloudfront.net/TBX8793/.jpg"
Q61: The pre-Keynesian or classical economic theory viewed
Q62: The aggregate supply curve will shift to
Q63: In the intermediate range of the aggregate
Q64: Which of the following is true ,
Q144: The aggregate supply curve indicates the<br>A) relationship