Multiple Choice
Exhibit 10-2 Aggregate supply and demand curves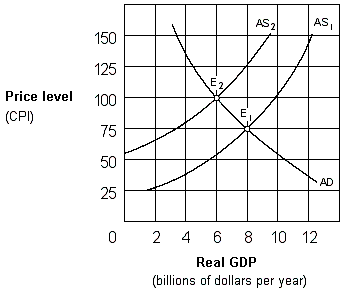
In Exhibit 10-2, the change in equilibrium from E1 to E2 represents:
A) cost-push inflation.
B) demand-pull inflation.
C) price-push inflation.
D) wage-push inflation.
Correct Answer:

Verified
Correct Answer:
Verified
Q39: Exhibit 10-6 Aggregate supply curve<br><img src="https://d2lvgg3v3hfg70.cloudfront.net/TBX8793/.jpg" alt="Exhibit
Q40: To illustrate the classical argument that "supply
Q41: Exhibit 10-6 Aggregate supply curve<br><img src="https://d2lvgg3v3hfg70.cloudfront.net/TBX8793/.jpg" alt="Exhibit
Q42: Exhibit 10-7 Aggregate supply and demand curves<br><img
Q43: Assuming prices and wages are fully flexible,
Q45: Along the intermediate range of the aggregate
Q46: Suppose the price level falls. The result
Q47: The real balances effect predicts that higher
Q48: The effect of an increase in aggregate
Q49: Exhibit 10-4 Aggregate supply and demand curves<br><img