Multiple Choice
Exhibit 10-3 Aggregate supply and demand curves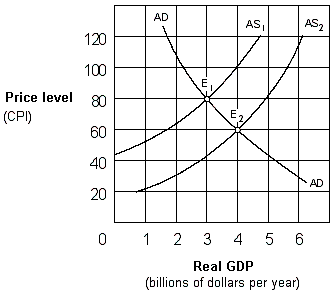
In Exhibit 10-3, the change in equilibrium from E1 to E2 represents:
A) deflation.
B) demand-pull inflation.
C) price-push inflation.
D) cost-push inflation.
Correct Answer:

Verified
Correct Answer:
Verified
Related Questions
Q70: Which of the following could not be
Q71: When the CPI is 300, a real
Q72: According to classical theory, if the aggregate
Q73: When the price level falls, the total
Q74: Exhibit 10-4 Aggregate supply and demand curves<br><img
Q76: The aggregate demand curve shows how real
Q77: Which of the following will most likely
Q78: Suppose the economy is on the intermediate
Q79: How are demand-pull and cost-push inflation reflected
Q80: When the supply of credit is fixed,