Multiple Choice
Exhibit 10-4 Aggregate supply and demand curves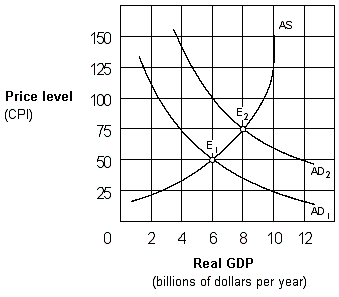
The increase in the price level as the economy moves from E1 to E2 in Exhibit 10-4 represents:
A) cost-push inflation.
B) demand-shock inflation.
C) wage push inflation.
D) demand-pull inflation.
Correct Answer:

Verified
Correct Answer:
Verified
Related Questions
Q84: In the United States during the 1960s,
Q85: The real balance effect (wealth effect), the
Q86: Which of the following reasons helps explain
Q87: In the aggregate demand/aggregate supply model, a
Q88: According to the interest rate effect, as
Q89: Given aggregate demand, a decrease in aggregate
Q91: In the intermediate range of the aggregate
Q92: The net exports effect is the _
Q94: In the upward-sloping segment of the aggregate
Q101: As prices rise, people will buy fewer