Multiple Choice
Exhibit 17-2 Aggregate demand and aggregate supply curves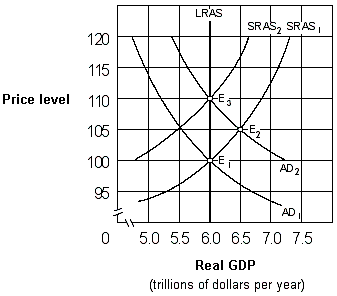
As shown in Exhibit 17-2, if people behave according to rational expectations theory, an increase in the aggregate demand curve from AD1 to AD2 will cause the price level to move:
A) directly from 100 to 105 and then remain at 105.
B) directly from 100 to 110 and then remain at 110.
C) from 100 to 105 initially and then eventually move back to 100.
D) from 100 to 105 initially and then eventually move to 110.
Correct Answer:

Verified
Correct Answer:
Verified
Q10: The modern view of the Phillips curve
Q12: The political business cycle refers to the
Q13: Exhibit 17-3 Aggregate demand and aggregate supply
Q14: If the long-run Phillips curve is vertical,
Q17: Experience with the Phillips curve since the
Q18: Which of the following best describes the
Q19: Explain why rational expectations theorists do not
Q46: The rational expectations theory indicates that expansionary
Q112: Starting from an initial long-run equilibrium, under
Q122: The Phillips curve illustrates the relationship between<br>A)