Multiple Choice
Exhibit 1A-9 Multi-curve graph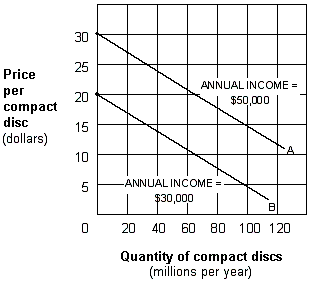
Exhibit 1A-9 represents a three-variable relationship. As the annual income of consumers falls from $50,000 (line A) to $30,000 (line B) , the result is a:
A) rightward movement along each curve.
B) leftward movement along each curve,.
C) leftward shift from curve A to curve B.
D) rightward shift from curve B to curve A.
Correct Answer:

Verified
Correct Answer:
Verified
Q126: Exhibit 10A-2 Macro AD-AS Model<br><img src="https://d2lvgg3v3hfg70.cloudfront.net/TBX8793/.jpg"
Q127: Exhibit 16A-3 Macro AD/AS Model<br><img src="https://d2lvgg3v3hfg70.cloudfront.net/TBX8793/.jpg" alt="Exhibit
Q128: If the amount of lemonade purchased and
Q129: Exhibit 1A-8 Straight line relationship<br><img src="https://d2lvgg3v3hfg70.cloudfront.net/TBX8793/.jpg" alt="Exhibit
Q130: The position of the long-run aggregate supply
Q132: Exhibit 6A-1 Budget line<br><br><img src="https://d2lvgg3v3hfg70.cloudfront.net/TBX8793/.jpg" alt="Exhibit 6A-1
Q133: The short-run aggregate supply curve (SRAS) is
Q134: Which of the following pairs is the
Q135: Economic growth can be represented by a
Q136: When an inverse relationship is graphed, the