Multiple Choice
Exhibit 1A-10 Multi-curve graph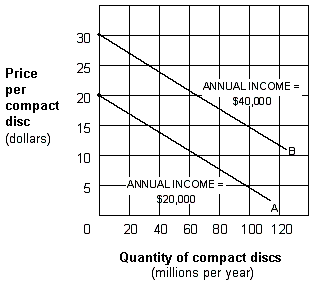
Exhibit 1A-10 represents a three-variable relationship. As the annual income of consumers rises from $20,000 (line A) to $40,000 (line B) , the result is a:
A) rightward movement along each curve.
B) leftward movement along each curve.
C) leftward shift from curve B to curve A.
D) rightward shift from curve A to curve B.
Correct Answer:

Verified
Correct Answer:
Verified
Q16: Exhibit 1A-4 Straight line<br><img src="https://d2lvgg3v3hfg70.cloudfront.net/TBX8793/.jpg" alt="Exhibit 1A-4
Q17: Along the short-run aggregate supply curve
Q18: Consumer surplus:<br>A) does not exist in equilibrium.<br>B)
Q19: Distinguish a direct and an inverse relationship.
Q20: If both the price level and nominal
Q22: Long-run full-employment equilibrium assumes:<br>A) a downward-sloping production
Q23: Beginning from full-employment macro equilibrium, increase
Q24: Assume the economy is experiencing an
Q25: Exhibit 6A-5 Consumer Equilibrium<br><br><img src="https://d2lvgg3v3hfg70.cloudfront.net/TBX8793/.jpg" alt="Exhibit 6A-5
Q26: Exhibit 6A-2 Consumer Equilibrium<br><br><img src="https://d2lvgg3v3hfg70.cloudfront.net/TBX8793/.jpg" alt="Exhibit 6A-2