Multiple Choice
Exhibit 3A-2 Comparison of Market Efficiency and Deadweight Loss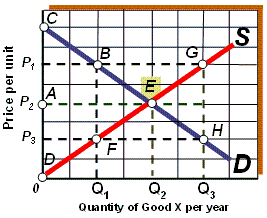
As shown in Exhibit 3A-2, if the quantity supplied of good X per year is Q1, the result is a deadweight loss represented by area:
A) BEG.
B) CBEFD.
C) EGH.
D) BEF.
Correct Answer:

Verified
Correct Answer:
Verified
Q40: <br>Exhibit 10A-3 Macro AD-AS Model<br><img src="https://d2lvgg3v3hfg70.cloudfront.net/TBX8793/.jpg" alt="
Q41: Along the short-run supply curve (SRAS),
Q42: Suppose two variables are inversely related. If
Q43: Exhibit 1A-4 Straight line<br><img src="https://d2lvgg3v3hfg70.cloudfront.net/TBX8793/.jpg" alt="Exhibit 1A-4
Q44: Moving along a budget line, the prices
Q46: An explanation for why the short-run aggregate
Q47: An indifference map states:<br>A) indifference curves farther
Q48: <br>Exhibit 10A-3 Macro AD-AS Model<br><img src="https://d2lvgg3v3hfg70.cloudfront.net/TBX8793/.jpg" alt="
Q49: Exhibit 6A-4 Consumer equilibrium<br><br><img src="https://d2lvgg3v3hfg70.cloudfront.net/TBX8793/.jpg" alt="Exhibit 6A-4
Q50: Beginning from the full-employment level of real