Multiple Choice
Exhibit 10A-1 Aggregate demand and supply model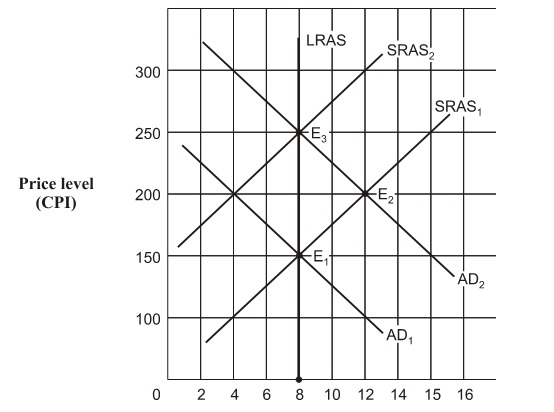
Beginning in Exhibit 10A-1 from long-run equilibrium at point E1, the aggregate demand curve shifts to AD2 . The economy's path to a new long-run equilibrium is represented by a movement from:
A) E 3 to E 1 to E 2 .
B) E 1 to E 3 to E 2 .
C) E 2 to E 1 to E 2 .
D) E 1 to E 2 to E 3 .
Correct Answer:

Verified
Correct Answer:
Verified
Q22: Long-run full-employment equilibrium assumes:<br>A) a downward-sloping production
Q23: Beginning from full-employment macro equilibrium, increase
Q24: Assume the economy is experiencing an
Q25: Exhibit 6A-5 Consumer Equilibrium<br><br><img src="https://d2lvgg3v3hfg70.cloudfront.net/TBX8793/.jpg" alt="Exhibit 6A-5
Q26: Exhibit 6A-2 Consumer Equilibrium<br><br><img src="https://d2lvgg3v3hfg70.cloudfront.net/TBX8793/.jpg" alt="Exhibit 6A-2
Q28: Exhibit 3A-2 Comparison of Market Efficiency and
Q29: Suppose Sam buys a good for $100
Q30: Exhibit 1A-7 Straight line relationship<br><img src="https://d2lvgg3v3hfg70.cloudfront.net/TBX8793/.jpg" alt="Exhibit
Q31: Exhibit 16A-2 Macro AD/AS Models<br><br><img
Q32: Which of the following explains why higher