Multiple Choice
Exhibit 10A-1 Aggregate demand and supply model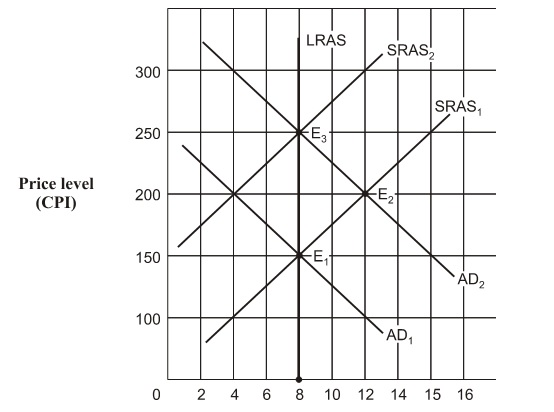
Beginning from long-run equilibrium at point E1 in Exhibit 10A-1, the aggregate demand curve shifts to AD2 . The real GDP and price level (CPI) in short-run equilibrium will be:
A) $12 billion and 200.
B) $8 billion and 250.
C) $8 billion and 150.
D) $12 billion and 250.
Correct Answer:

Verified
Correct Answer:
Verified
Q4: Exhibit 6A-2 Consumer Equilibrium<br><br><img src="https://d2lvgg3v3hfg70.cloudfront.net/TBX8793/.jpg" alt="Exhibit 6A-2
Q5: Exhibit 3A-2 Comparison of Market Efficiency and
Q6: A decrease in nominal incomes cause
Q7: Producer surplus measures the value between the
Q8: A shift in a curve represents a
Q10: Exhibit 16A-2 Macro AD/AS Models<br><br><img
Q11: In the self-correcting AD-AS model, the economy's
Q12: If nominal wages and salaries are fixed
Q13: In an efficient market, deadweight loss is
Q14: Exhibit 6A-2 Consumer Equilibrium<br><br><img src="https://d2lvgg3v3hfg70.cloudfront.net/TBX8793/.jpg" alt="Exhibit 6A-2