Multiple Choice
Figure 2-1 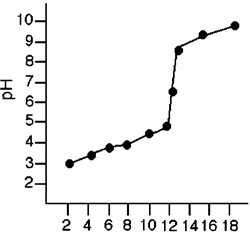 Refer to Figure 2-1. Which of these statements is true based on the data provided by the graph?
A) The pH of the solution must be determined algebraically.
B) The pH of the solution is relatively unaffected by the addition of the base.
C) The pH of the solution is 7 when approximately 16 mL of the base has been added.
D) The pH of the solution is relatively constant after the addition of the first 14 mL of the base.
E) The pH of the solution rises significantly when the volume of the base is increased from 14 mL to 18 mL.
Correct Answer:

Verified
Correct Answer:
Verified
Q46: Which among the following is an equivalent
Q47: Convert 10.5 mm/s to ft/hr.<br>A) 124 ft/hr<br>B)
Q48: Solve the problem. <br>3.728 + 6.272 =
Q49: The result of an addition or subtraction
Q50: Identify the non-significant term in 0.5467<br>A) 0<br>B)
Q52: Solve the following equation for x: 13x
Q53: The equivalent of 31456 g is _.<br>A)
Q54: Which of these is the correct normal
Q55: An irregularly shaped piece of metal with
Q56: One in <sup> 3 </sup> equals _.<br>A)