Multiple Choice
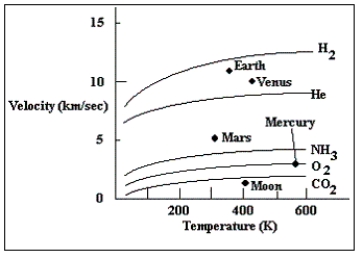
-The graph plots the escape velocity of several solar system objects along the vertical axis,and surface temperature along the horizontal.The lines plotted in the figure are the average speeds of gas particles as a function of temperature for various gases.Which of the objects plotted in this diagram has the highest escape velocity?
A) Mars
B) the Moon
C) Venus
D) Earth
Correct Answer:

Verified
Correct Answer:
Verified
Q49: The absence of folded mountain ranges on
Q53: What does the presence of vesicular basalts
Q112: Why is volcanism associated with regions where
Q113: Mercury's smooth plains are probably the oldest
Q114: Valles Marineris is a long valley on
Q117: Oxygen in the Earth's atmosphere is outgassed
Q118: The central part of the Earth's core
Q119: The Earth's magnetic field has reversed itself.
Q121: Why is the Moon no longer geologically
Q122: What is believed to be the cause