Multiple Choice
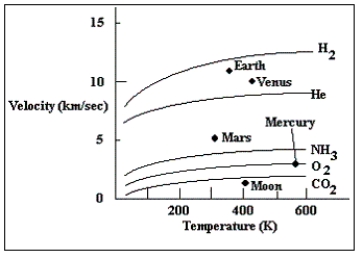
-The graph plots the escape velocity of several solar system objects along the vertical axis,and surface temperature along the horizontal.The lines plotted in the figure are the average speeds of gas particles as a function of temperature for various gases.Which of the objects plotted in this diagram is least able to hold an atmosphere?
A) Mars
B) the Moon
C) Mercury
D) Venus
Correct Answer:

Verified
Correct Answer:
Verified
Q27: Fragmenting during meteorite impacts produced the breccias
Q28: The oldest parts of the Earth's crust
Q29: How is the Moon's lack of a
Q30: _ formed as Mercury cooled and shrank.
Q31: Evaluate the evidence that Mars had liquid
Q34: _ is responsible for absorbing ultraviolet radiation
Q35: Which of the following planets has the
Q36: Which of the following maintains the supply
Q37: Most terrestrial planets have portions of their
Q68: Flow channels on Venus suggest it was