Multiple Choice
The graph that shows intrapleural pressure changes during normal spontaneous breathing is depicted by which of the following?
A) 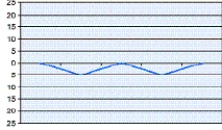
B) 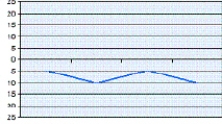
C) 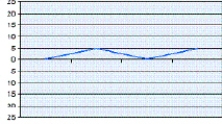
D) 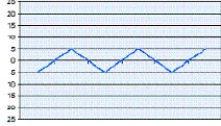
Correct Answer:

Verified
Correct Answer:
Verified
Related Questions
Q21: Use this figure to compute the static
Q22: Calculate the effective static compliance (Cs)given the
Q23: Based upon the following patient information,calculate the
Q24: During spontaneous inspiration alveolar pressure (PA)is about:
Q25: Plateau pressure (Pₚₗₐₜₑₐᵤ)is measured during which phase
Q27: Air accidentally trapped in the lungs due
Q28: Evaluate the combinations of compliance and
Q29: Calculate the pressure needed to overcome airway
Q30: Calculate the pressure required to achieve a
Q31: Calculate the static compliance (Cs),in mL/cm H₂O,when