Multiple Choice
Which of the following graphs is most likely to portray an interaction?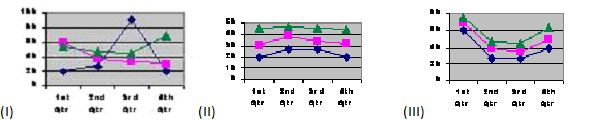
A) I
B) II
C) III
D) There is no interaction in any of these.
Correct Answer:

Verified
Correct Answer:
Verified
Related Questions
Q43: The overall effect of an independent variable
Q44: Pliner and Chaiken (1990) wanted to investigate
Q45: To calculate the F for a simple
Q46: When we compute an effect size measure
Q47: What type of design is the above
Q49: Dr. Gates looked at the effects of
Q50: When you compare the effect of one
Q51: In a factorial design a cell is<br>A)
Q52: To calculate the sum of squares for
Q53: If the analysis of variance is significant,