Multiple Choice
In the three graphs below, which one is most likely to have a main effect for quarters (the variable that increases along the X axis) ?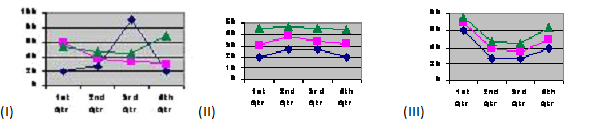
A) I
B) II
C) III
D) none.
Correct Answer:

Verified
Correct Answer:
Verified
Related Questions
Q22: In a factorial analysis of variance you
Q23: A simple effect is defined as<br>A) part
Q24: Use the following ANOVA summary table to
Q25: Use the following ANOVA summary table to
Q26: A human resources director for a large
Q28: In the Spilich et al. study of
Q29: The degrees of freedom for an interaction
Q30: In a study which investigated the effects
Q31: The mean difference in GPA based on
Q32: A doctor examining the effectiveness of smoking