Multiple Choice
In this graph we can see that there is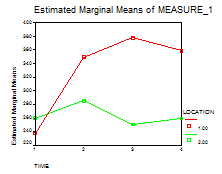
A) a significant difference between Location 1 at time 1 and Location 2 at time 1.
B) an interaction between location and time.
C) a significant post hoc analysis.
D) a quadratic significant correlation.
Correct Answer:

Verified
Correct Answer:
Verified
Related Questions
Q59: To calculate the F for a simple
Q60: A simple effect is calculated by<br>A) looking
Q61: What value appears in each identified cell
Q62: Unequal sample sizes in a factorial analysis
Q63: In graph I below, the most apparent
Q65: The mean difference in GPA based on
Q66: A factorial analysis of variance involves more
Q67: In a factorial design involving the sex
Q68: When we say that a measure is
Q69: The finding that women eat less in