Multiple Choice
This graph represents a/an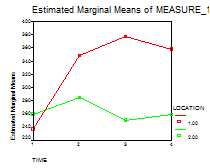
A) repeated-measures design
B) one-way ANOVA
C) 2 × 5 factorial
D) significant alpha
Correct Answer:

Verified
Correct Answer:
Verified
Related Questions
Q52: To calculate the sum of squares for
Q53: If the analysis of variance is significant,
Q54: Calculate and interpret F for each effect
Q55: Use the following research scenario to answer
Q56: If you have a significant interaction, you
Q58: Use the following research scenario to answer
Q59: To calculate the F for a simple
Q60: A simple effect is calculated by<br>A) looking
Q61: What value appears in each identified cell
Q62: Unequal sample sizes in a factorial analysis