Essay
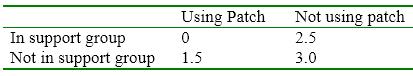
-Plot the data from the previous question three times (each main effect and the interaction effect); interpret the graphs.
Correct Answer:

Verified
The graphs suggest that there are main e...View Answer
Unlock this answer now
Get Access to more Verified Answers free of charge
Correct Answer:
Verified
The graphs suggest that there are main e...
View Answer
Unlock this answer now
Get Access to more Verified Answers free of charge
Related Questions
Q30: In a study which investigated the effects
Q31: The mean difference in GPA based on
Q32: A doctor examining the effectiveness of smoking
Q33: The notation <img src="https://d2lvgg3v3hfg70.cloudfront.net/TBX8869/.jpg" alt="The notation
Q34: A researcher noted that there was a
Q36: If ω<sup>2</sup> is calculated to yield the
Q37: The following is a printout from SPSS.<br><img
Q38: A human resources director for a large
Q39: _ are the effect of one variable
Q40: A 2 × 4 factorial has<br>A) 8