Multiple Choice
The Center for Disease Control has published statistics relating maternal smoking to low birth weight. The data follow in terms of the percentage of birth weights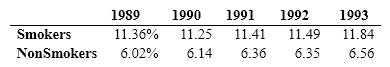
Which of the following ways of presenting the data would be most informative?
A) a histogram
B) a time series graph with a line for smokers and one for non-smokers
C) two pie charts
D) a stem-and-leaf display
Correct Answer:

Verified
Correct Answer:
Verified
Q24: Frequency distributions are used<br>A) as a first
Q25: Draw a distribution that is negatively skewed.
Q26: Displaying data on graphs<br>A) can aid communication
Q27: The next six questions are based on
Q28: Which of the following is the least
Q30: If you created a stem-and-leaf display of
Q31: Someone asks you if you have seen
Q32: "5s" represents what numbers on a stem-and-leaf
Q33: The next six questions are based on
Q34: Assume that you have a set of