True/False
Answer the next two questions based on the following box-plot.
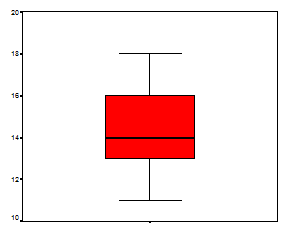
The median of this distribution is 16.
Correct Answer:

Verified
Correct Answer:
Verified
Related Questions
Q5: Which of the following is NOT a
Q6: Trimmed statistics are calculated based on the
Q7: Measures of variability refer to the dispersion
Q8: The problem with measuring dispersion by merely
Q9: People in the stock market refer to
Q11: Which of the following sets of data
Q12: Compare the distribution of exam scores for
Q13: Which of the following is NOT a
Q14: Given the following distribution, which would be
Q15: <img src="https://d2lvgg3v3hfg70.cloudfront.net/TBX8869/.jpg" alt=" -Based on