Multiple Choice
The data illustrated in the graph below suggest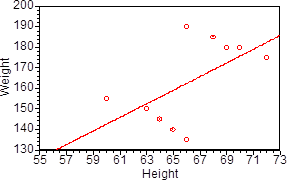
A) that there is a strong positive relationship between height and weight.
B) that there is no relationship between height and weight.
C) that some other variable is involved in the relationship.
D) that these data are unreliable.
Correct Answer:

Verified
Correct Answer:
Verified
Q2: When we use heterogeneous subsamples of data,
Q3: The difference between a point biserial coefficient
Q4: Restricted range has no effect on correlation
Q5: A curvilinear relationship is one in which<br>A)
Q6: A newspaper headline writer found that the
Q8: In testing the significance of a correlation
Q9: Correlation coefficients can range from -1 to
Q10: A reliable correlation is one that<br>A) is
Q11: Point biseral correlation is used when one
Q12: Which of the following represents a closer