Short Answer
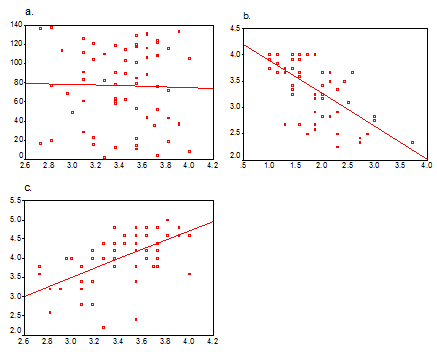
Indicate the types of relationships illustrated in the following graphs. (e.g., positive, negative, no relationship, curvilinear).
Correct Answer:

Verified
a. no rela...View Answer
Unlock this answer now
Get Access to more Verified Answers free of charge
Correct Answer:
Verified
a. no rela...
View Answer
Unlock this answer now
Get Access to more Verified Answers free of charge
Related Questions
Q20: Which r-value represents the strongest correlation?<br>A) +.50<br>B)
Q21: The correlation in the population is denoted
Q22: When we say that a correlation coefficient
Q23: Give an example of a: <br>a. positive
Q24: We want to demonstrate that a relationship
Q26: The following is a scatterplot of data
Q27: Which of the following is NOT a
Q28: A _ refers to the degree of
Q29: Give an example of a relationship that
Q30: In the previous question, a "best-fitting" line