Essay
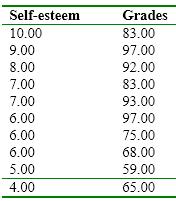
Make a scatterplot of the following data and draw a line of best fit.
Correct Answer:

Verified
Sample sca...View Answer
Unlock this answer now
Get Access to more Verified Answers free of charge
Correct Answer:
Verified
Sample sca...
View Answer
Unlock this answer now
Get Access to more Verified Answers free of charge
Related Questions
Q49: Which of the following is the formula
Q50: The following is an example of a
Q51: If the R squared between brain size
Q52: If we look at the correlation between
Q53: A researcher is predicting exam scores based
Q55: A correlation of .65 between depression and
Q56: We look at a number of states
Q57: If the correlation between two variables is
Q58: A scatterplot can be used to visualize
Q59: A dichotomous variable is one that<br>A) can