Essay
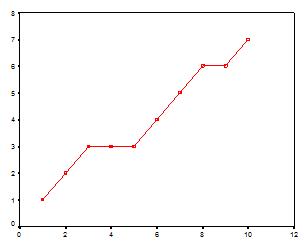
Describe the following graph.
Correct Answer:

Verified
The graph shows a mo...View Answer
Unlock this answer now
Get Access to more Verified Answers free of charge
Correct Answer:
Verified
The graph shows a mo...
View Answer
Unlock this answer now
Get Access to more Verified Answers free of charge
Related Questions
Q61: Inglehart (1990) presented data on the relationship
Q62: Given the following pairs of data for
Q63: If high scores on X are paired
Q64: The correlation between two variables is defined
Q65: The covariance between height and running speed
Q66: When the data are in the form
Q67: When we say that the correlation between
Q68: The correlation between amount of caffeine consumed
Q70: For a given set of data the
Q71: We can often use a Pearson correlation