Multiple Choice
The figure below shows equilibrium in an aggregate demand-aggregate supply model. Which of these statements is true if the economy described by this figure is at point M on SRAS100?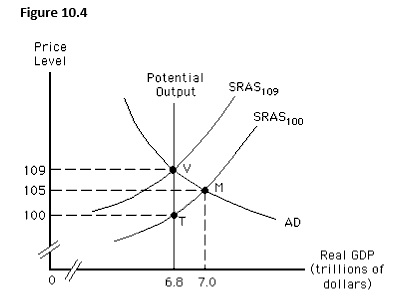
A) The actual price level is lower than expected with a $200 billion expansionary gap.
B) The actual price level is lower than expected with a $200 billion recessionary gap.
C) The actual price level is higher than expected with a $200 billion recessionary gap.
D) The actual price level is higher than expected with a $200 billion expansionary gap.
E) The economy is in equilibrium in the short run and the long run.
Correct Answer:

Verified
Correct Answer:
Verified
Q1: Which of the following is true of
Q30: An expansionary gap is equal to:<br>A)real GDP
Q43: Which of the following does not influence
Q67: In constructing a short-run aggregate supply curve,we
Q83: Potential output is the amount produced when:<br>A)firms'
Q96: Given a downward-sloping aggregate demand curve,if short-run
Q99: As actual output falls below the potential
Q114: An expansionary gap is closed in the
Q130: Cyclical unemployment in an economy will be
Q142: The figure below shows equilibrium in an