Multiple Choice
The figure given below depicts long run equilibrium in an aggregate demand-aggregate supply model. The change in real GDP in this figure from Y1 to Y2 could have been caused by: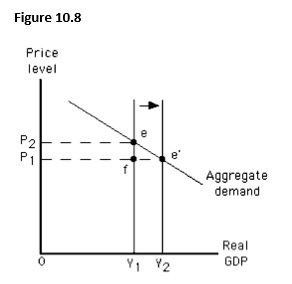
A) a government policy aimed at increasing demand.
B) a change in weather conditions that led to worldwide crop failures.
C) an attempt by key resource producers to monopolize supply.
D) an increase in taxation or a decrease in government spending.
E) an increase in labor productivity.
Correct Answer:

Verified
Correct Answer:
Verified
Q7: If nominal wage rates increase by 5
Q44: An adverse supply shock would shift:<br>A)only the
Q93: Which of these is most likely to
Q98: For the aggregate demand and aggregate supply
Q100: If the rate of increase in the
Q101: If nominal wage rates increase by 2
Q109: Suppose Jack's salary increased from $100,000 to
Q119: If the price level in an economy
Q144: Which of the following is generally true
Q146: Suppose the price level increases by 5