Multiple Choice
The figure given below shows equilibrium in a money market. If S is the supply curve, the equilibrium interest rate and quantity of money will be: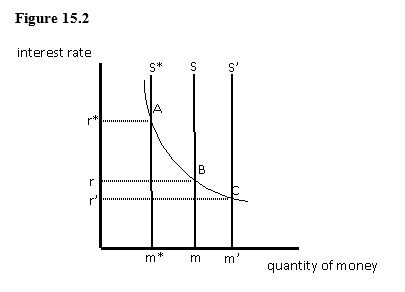
A) r and m, respectively.
B) r* and m*, respectively.
C) r' and m', respectively.
D) r and m', respectively.
E) r' and m*, respectively.
Correct Answer:

Verified
Correct Answer:
Verified
Q11: If the Fed sells U.S.government securities in
Q28: Which of the following changes will shift
Q44: Since the Federal Reserve was established in
Q50: If the short-run aggregate supply curve is
Q56: If real output and velocity are stable
Q63: The figure given below shows the interest
Q69: Which of the following statements about the
Q71: According to the quantity theory of money,if
Q85: Given an upward sloping aggregate supply curve,which
Q101: Over the past 40 years,the most frequent