Multiple Choice
The figure given below shows short run and long run equilibrium in an aggregate demand-aggregate supply model. The economy shown in this figure is: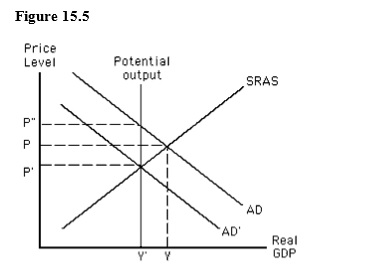
A) in a long-run equilibrium at the price level P and income level Y.
B) in a short-run equilibrium at the price level P and income level Y.
C) experiencing a contractionary gap at price level P and income level Y.
D) experiencing an expansionary gap at price level P" and income level Y'.
E) in a short-run equilibrium at the price level P' and income level Y.
Correct Answer:

Verified
Correct Answer:
Verified
Q12: If the Fed sells U.S.government securities to
Q15: In the long run,an expansionary monetary policy
Q43: The equilibrium interest rate in a money
Q46: When calculating how much changes in the
Q96: In an economy in which real output
Q97: The Dodd-Frank Act gave the Fed and
Q106: Which of these is an advantage of
Q112: A decrease in the money supply in
Q137: The quantity theory of money assumes that
Q142: The figure given below shows the aggregate