Multiple Choice
The table below shows the price indexes and the nominal gross domestic product (GDP) for an economy from 2001 to 2005. The real GDP _____ between 2001 and 2002. 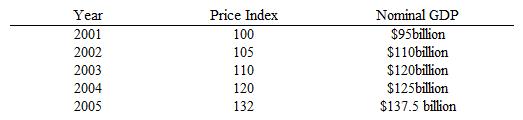
A) increased by slightly less than $10 billion
B) decreased by slightly more than $5 billion
C) remained constant
D) increased by only about $1 billion
E) increased more than $20 billion
Correct Answer:

Verified
Correct Answer:
Verified
Q15: Suppose the real gross domestic product (GDP)equals
Q47: Inventories help manufacturers cope with unexpected changes
Q66: The table below shows the price indexes
Q66: If a firm hires labor for $6,000,pays
Q68: The table below shows the price indexes
Q82: Real gross domestic product (GDP)shows:<br>A)total spending on
Q104: Gross domestic product (GDP)figures tend to understate
Q116: Rhonda sells a house she has owned
Q133: Gross domestic product (GDP)is not a perfect
Q136: Depreciation refers to a decrease in the